One of the most tedious tasks about building software is tracing errors that manifest when testing.
Where does trouble hide?
If you’re lucky, you get a stack trace, but this stack trace is almost always squirreled away inside a container or server log. If you’re testing a website in a browser, this typically means finding a terminal window or log file and copying and pasting file name into an editor, possibly with a line number, to find the code that caused the issue.
A common process could be:
- SSH into server or connect to a docker container
- Change to one of many log directories
- grep through the logs to find the error and/or stack trace
- Switch back to the IDE
Business users or maybe QA testers might not have the tools to convey what or where something went wrong. Information may be inaccessible to them and “The report doesn’t work” might be all the information you get.
If an automated selenium test is running against a headless container, you might be at a loss as to what the screen looked like when the test failed.
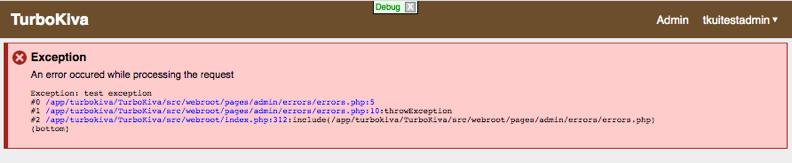
If the problem is in production, it can be difficult surface errors to the user such that they are actionable and can be clearly communicated to across a support team to developers. Generic errors make tracking down the source of an error or steps to reproduce difficult.
Why bother making an effort
Implementing visible error handling and integrated stack traces will save you a ton of research time and code navigation time.
Users may be able to work around problems in your application
Surfacing technical errors in the user interface when running on non-prod
Surfacing technical aspects of an error, like a stack trace, will help reduce research costs when investigating issues. Developers save time by skipping a step or two when researching what went wrong. Non-technical users will benefit because they will be able to send developers more information about a problem.
Hyperlinked stack traces using IDEA links
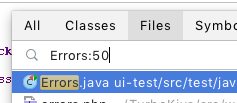
It’s already pretty easy to navigate to files and line numbers in IntelliJ IDEA (and related products like PyCharm, PHPStorm, RubyMine, WebStorm, etc). Just enter part of a file name and the line number:
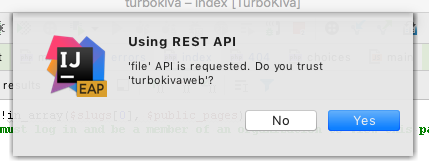
But what if we can skip this step entirely? Enter IDEA’s REST API. This API can be leveraged to directly link from a stack trace in a browser or log to the line in IDEA. The first invocation will trigger this security check:
After which, clicking on a hyperlinked stack frame will jump directly to the code

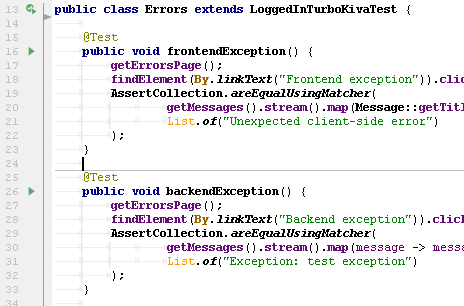
JS implementation:
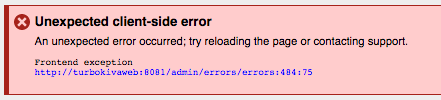
window.onerror = function(msg, source, lineno, colno, error){
const url = new URL(source);
let folder = url.pathname.endsWith('.js')?'':'pages';
let extension = url.pathname.endsWith('.js')?'':'.php';
message({
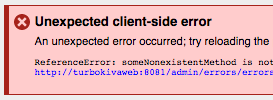
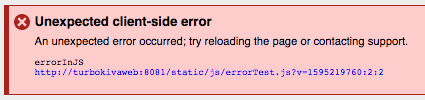
title: "Unexpected client-side error",
message: "An unexpected error occurred; try reloading the page or contacting support.",
type: message.ERROR,
exception: `${error}
fetch('http://localhost:63342/api/file/TurboKiva/src/webroot${folder}${url.pathname}${extension}:${lineno}');">${source}:${lineno}:${colno}`
});
}
PHP implementation:
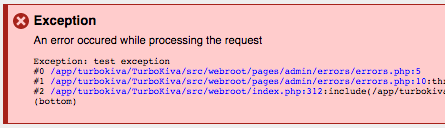
function getStackTraceLink($file, $line, $args, $printLinks = true)
{
   $text = ($file ?? '') . ':' . ($line ?? '');
   if (!$printLinks)
      return $text . $args;
   $filePath = preg_replace("(.*/TurboKiva/src/webroot/)", 'TurboKiva/src/webroot/', $file);
   $url = "http://localhost:63342/api/file/$filePath:$line";

   return "$text" . $args;
}
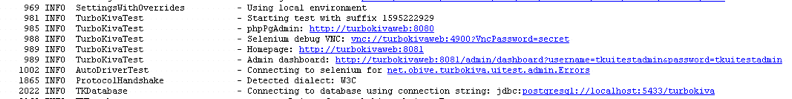
Exposing selenium tests using VNC and screenshots
Running selenium tests in a headless docker container can make it difficult to see what went wrong.
Selenium publishes debug version of their docker image selenium/node-chrome-debug which runs an integrated VNC server. Make it easy to connect by hyperlinking to the URL on test startup:

Additionally, expose screenshots of test failures:
Screenshots can also be exposed using TeamCity test attachments
Java code to take a screenshot and print a link:
static {
   isTeamCity = Boolean.parseBoolean(System.getenv("teamcity"));
   if (isTeamCity) {
      log.info("Running in TeamCity");
      artifactDirectory = new File("./ui-test/artifacts");
      log.info("Artifact directory: " + artifactDirectory.getAbsolutePath());
      if (artifactDirectory.exists()) {
         try {
            log.info("Clearing artifact directory");
            FileUtils.cleanDirectory(artifactDirectory);
         } catch (IOException e) {
            log.error("Unable to clear artifact directory", e);
         }
      } else {
         log.info("Creating artifact directory");
         if (!artifactDirectory.mkdirs())
            log.error("Could not create artifact directory");
      }
   }
}

public void takeScreenshotAndPrintLink(RemoteWebDriver webDriver) {
   try {
      File screenshotFile = createArtifactOrTempFile("TurboKivaScreenshot", ".png");
      Files.write(screenshotFile.toPath(), webDriver.getScreenshotAs(OutputType.BYTES));
      if (isTeamCity) {
         log.info("Writing screenshot: " + screenshotFile.getAbsolutePath());
         System.out.printf("##teamcity[testMetadata type='image' value='%s']%n",
               screenshotFile.toPath().toString()
         );
      } else {
         log.error("See screenshot of failure: " + screenshotFile.toURI());
      }
   } catch (Exception e) {
      e.printStackTrace();
   }
}

private File createArtifactOrTempFile(String prefix, String suffix) throws IOException {
   if (isTeamCity) {
      return File.createTempFile(prefix, suffix, artifactDirectory);
   } else {
      return File.createTempFile(prefix, suffix);
   }
}
I also use a TestNG TestListener to get a screenshot of every failure:
public class AudoDriverScreenshoter implements ITestListener {
   private static final Logger log = LoggerFactory.getLogger(AudoDriverScreenshoter.class);

   @Override
   public void onTestFailure(ITestResult result) {
      try {
         AutoDriverTest instance = (AutoDriverTest) result.getInstance();
         instance.takeScreenshotAndPrintLink(instance.getWebDriver());
      }catch(Exception ex){
         log.error("Could not take screenshot of test failure", ex);
      }
   }
}
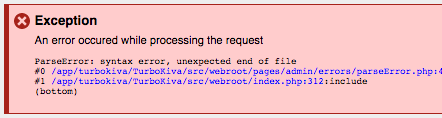
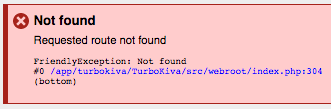
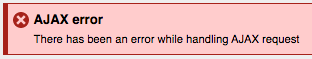
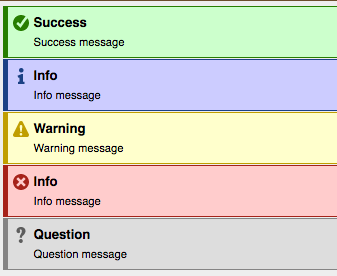
Consistent messaging for frontend and backend, including AJAX calls
Providing a consistent look and feel for errors and messages makes for a polished UX and helps with tooling. I consider the following fields as a good base: type, title, description, technical (omitted on prod)
Exposing a similar API for both PHP and JS allow for easy development. A common format for AJAX results can even include messages and integarted with a frontend framework to make it trivial to bubble up actionable errors from the backend without involving matching frontend changes.
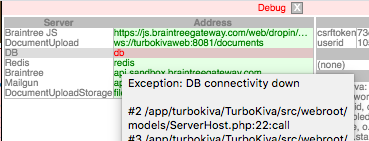
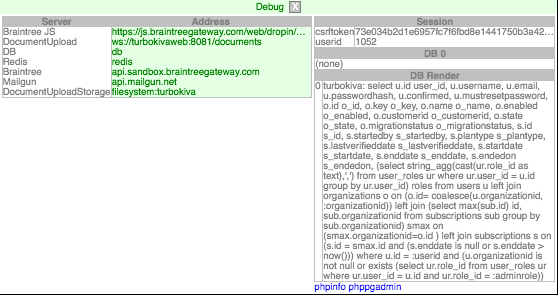
Debug tools
I find it helpful to expose a list of environment information on non-prod and for admins on prod. This will make it a lot easier to diagnose issues with environments. This will also drastically reduce a flood of QA tickets when an environment issue arrises. It also lets testers load tickets up with delicious technical details so that engineers can quickly get to the root of a problem without going back and forth with testers.

Some platforms and frameworks already have sophisticated tools built in or tools contributed by the community:
- Laravel: https://github.com/barryvdh/laravel-debugbar
- Django: https://github.com/jazzband/django-debug-toolbar
Selenium base test
All my tests need similar functionality so I've written my own base class to provide common functionality. One of the most valuable features is automatically giving each test class a fresh, clean database to execute against.
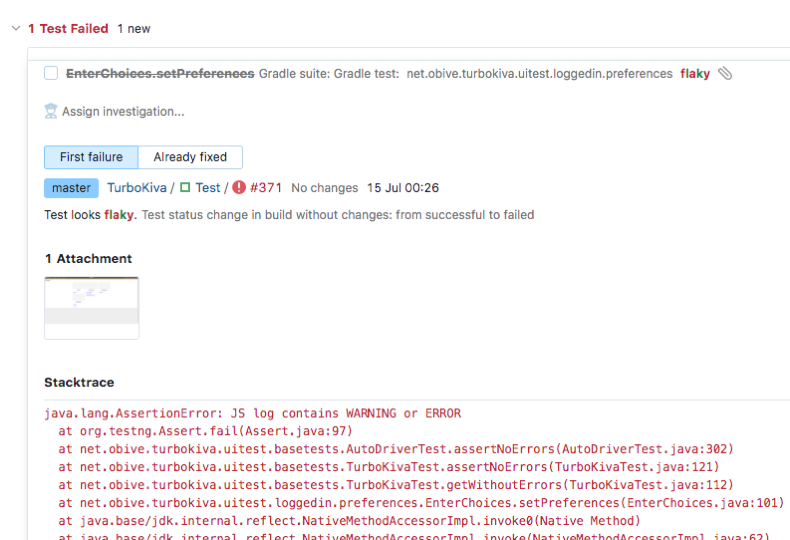
Another benefit to a common base test is easier access to selenium. Because of the consistent messeging, its easy to trigger a test failure if ERROR messages are detected at the end of any test.
IDEA integration
IDEA provides excellent code navigation between tests. Maximizing these features requires properly configuring IDEA. Once configured, it's trivial to run a single test, navigate between tests, and to re-run failed tests.
Hyperlinks that authenticate
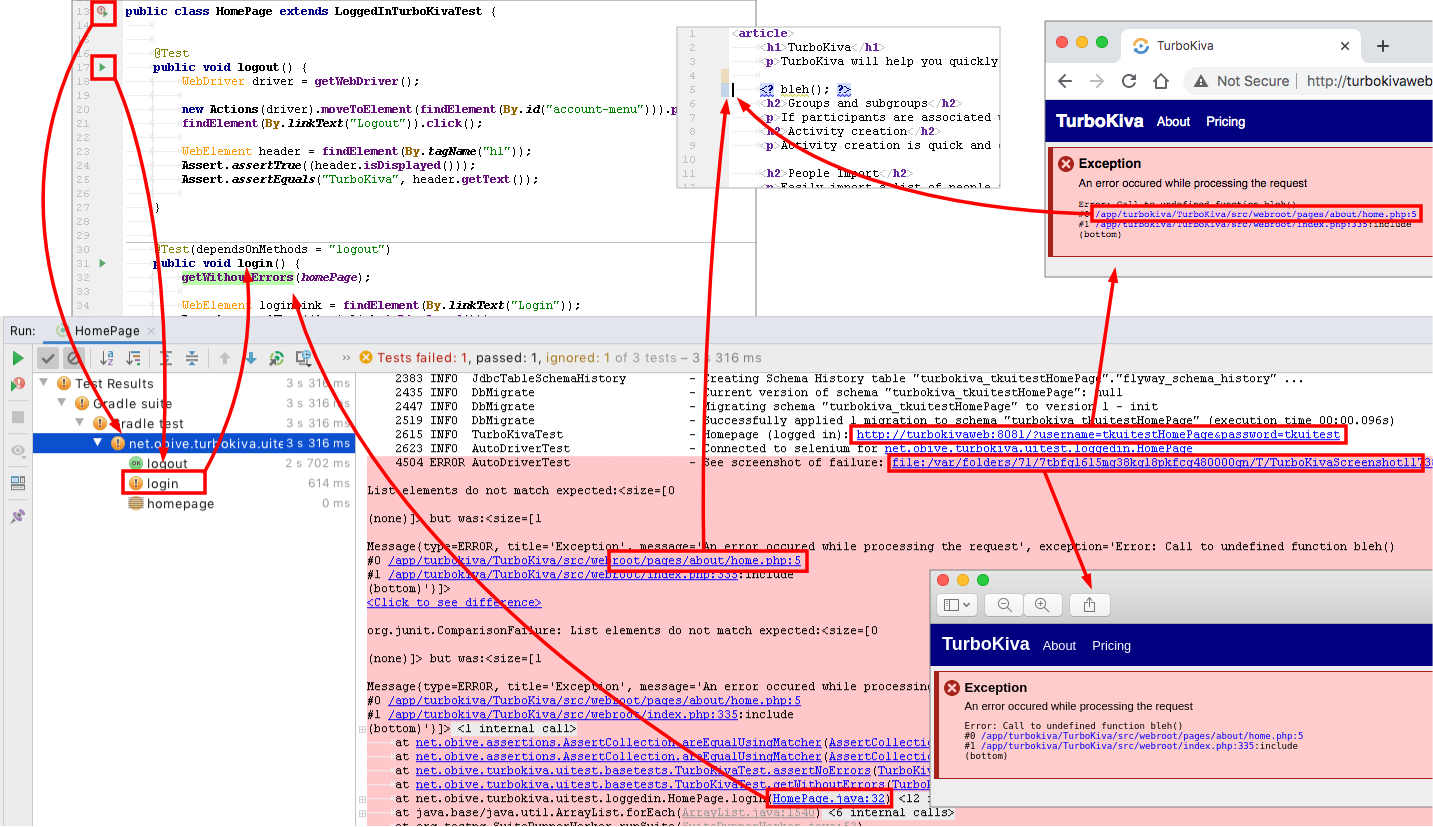
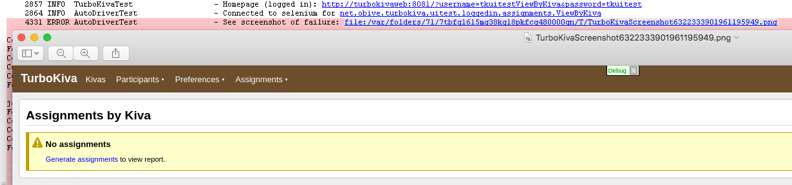
When a test fails, the next case is almost always to attempt to reproduce. To speed up reproduction, print a link that instantly logs into the application with the test user with the existing test data. This makes logging in even easier than using a password manager.
Here you can see a log entry "Homepage (logged in)" that opens a browser to the account for this test case. When a failure occures, you can use this link to jump right into where it failed to see where things went wrong.
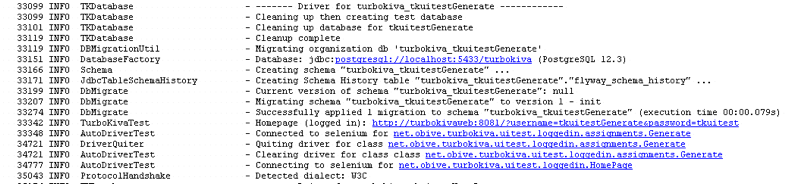
Here we have a link that logs directly into the admin dashboard and other services like VNC into Selenium:
Conclusion
Investing time into error handling and messaging to enable better visibility when things go wrong and enable quick code navigation pays off dividends over the life of a project.